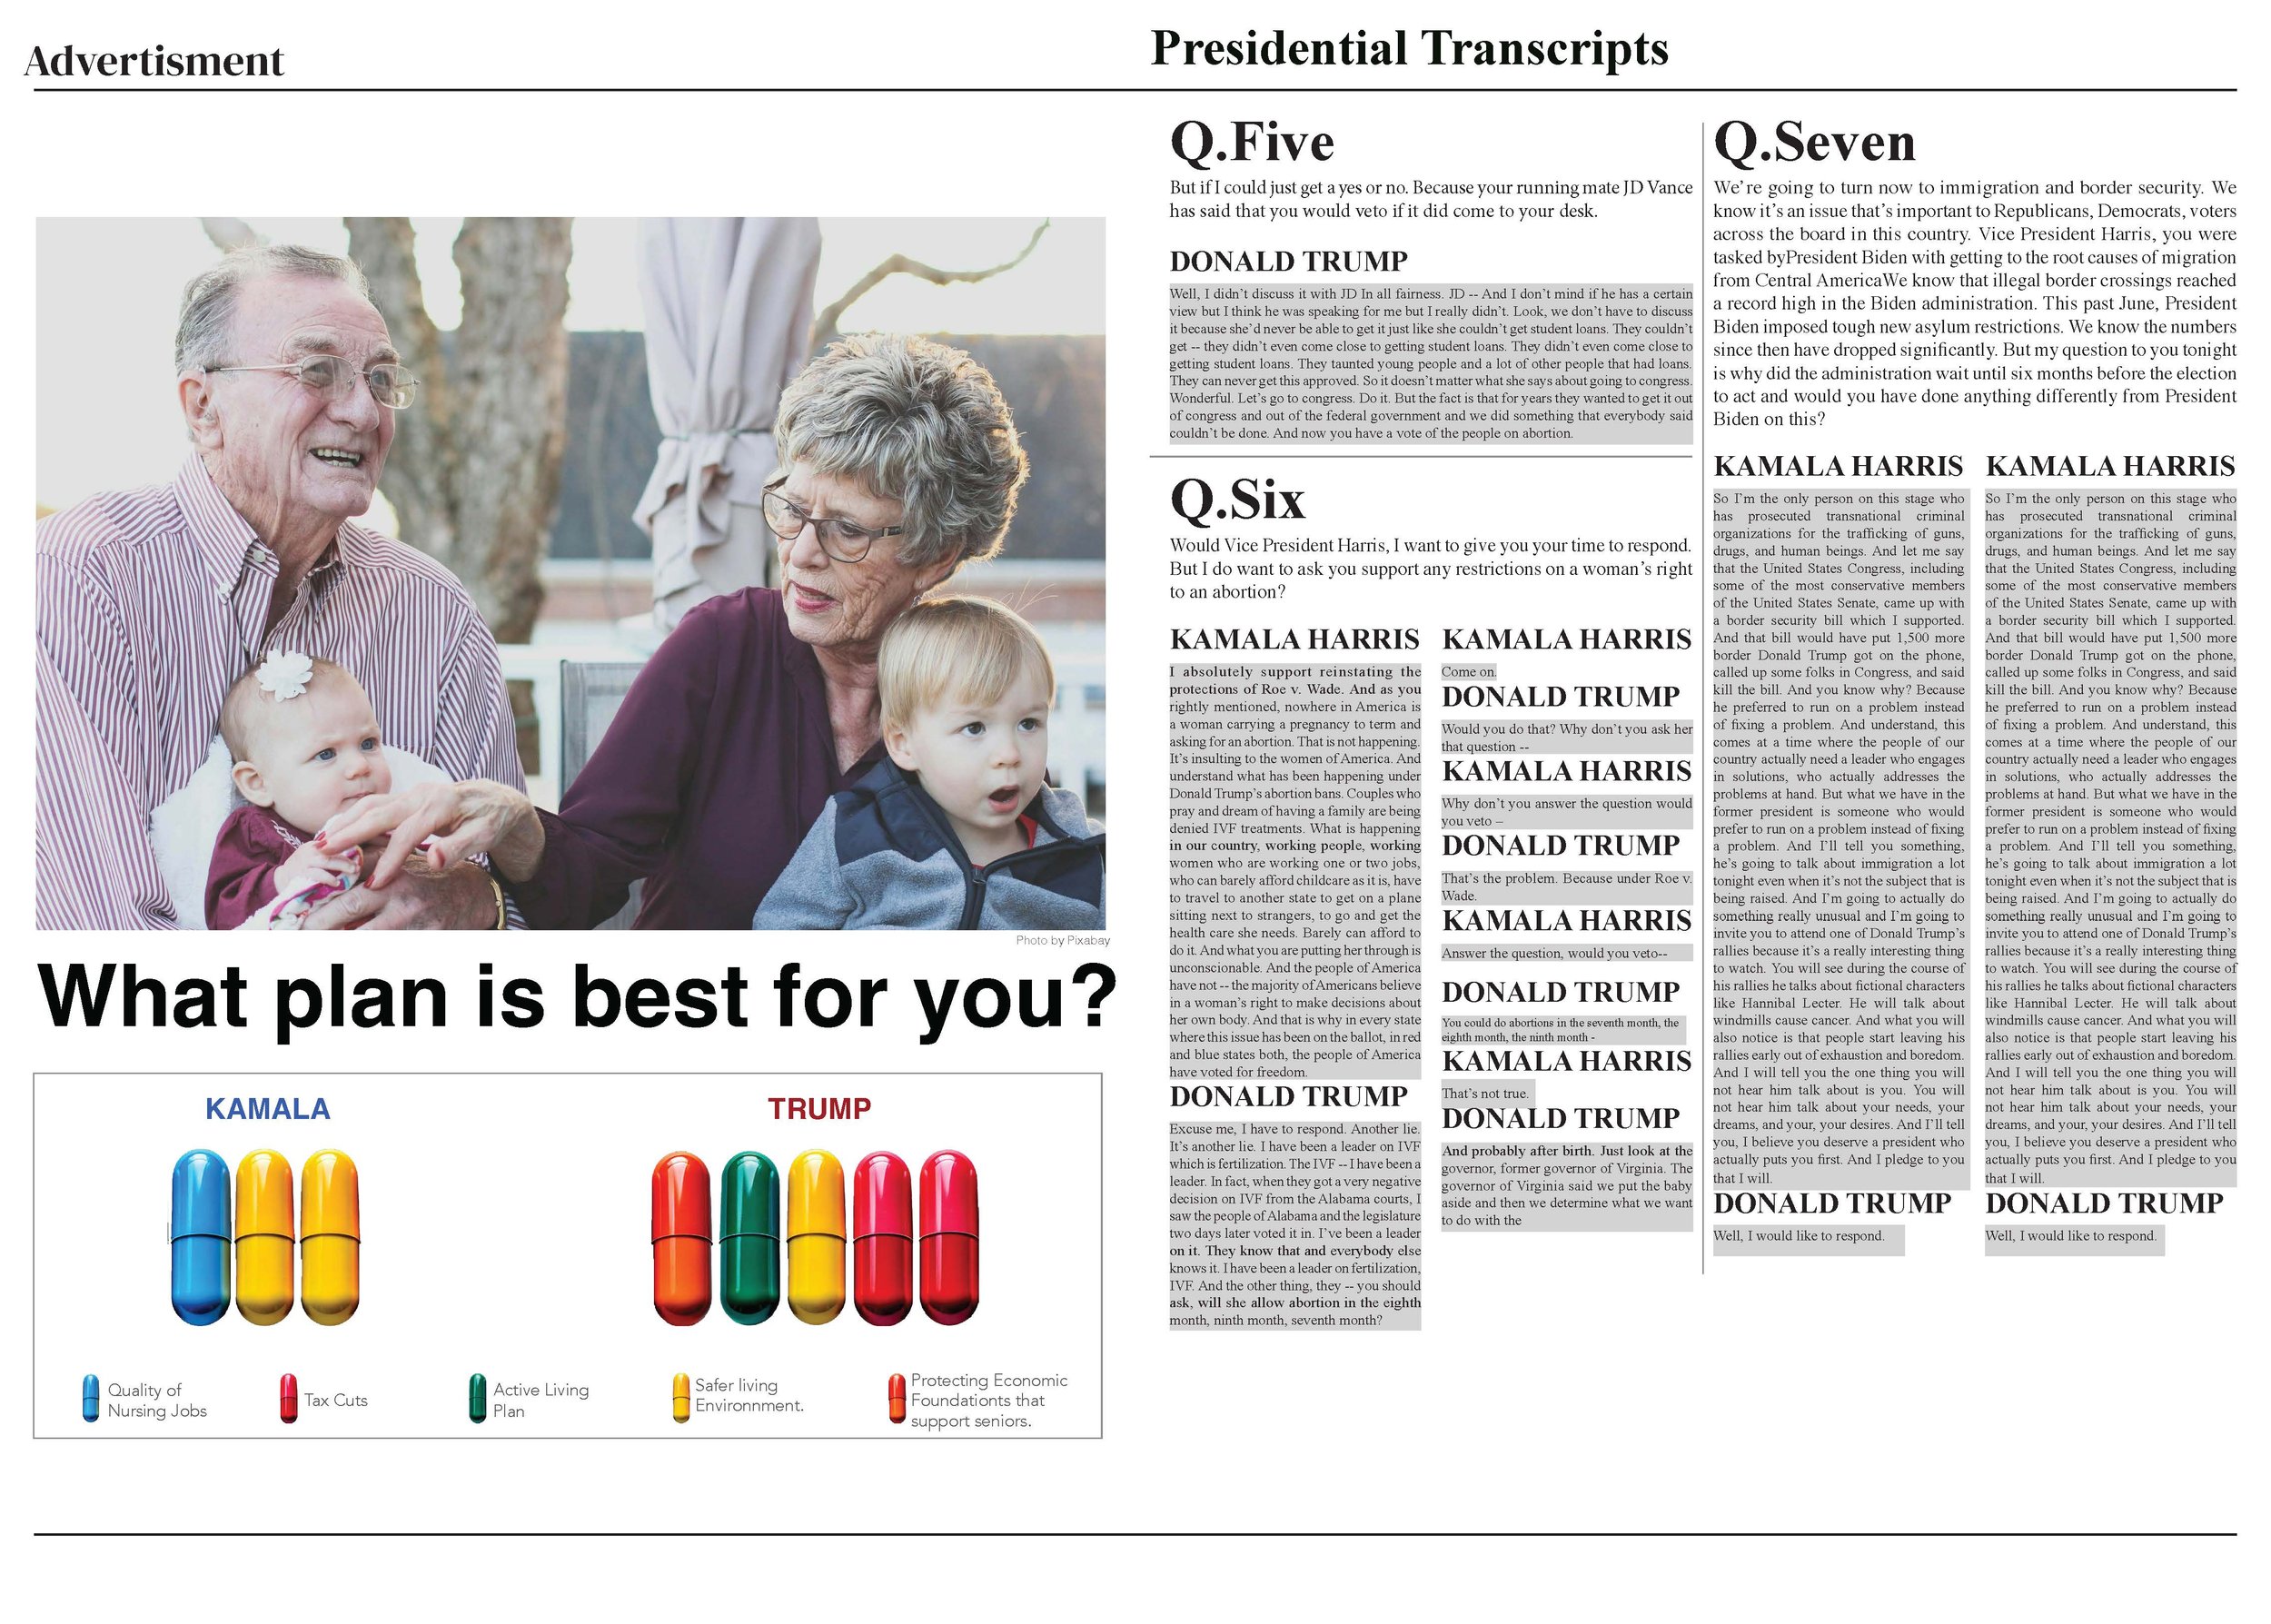
For this course we were learning bout the visualization of data and how to tell a cohesive story. We did two projects, the first over the presidential election and another over a truth and a lie. You will see the presidential election data newspaper first then you will see the truth and lie.


